Background
In the process of building my Ray Tracer one of the quite understandable hurdles I ran into was performance when wanting to render more complex scenes. So to try and overcome this I used various tools to analyse the problem areas in my program and try and mitigate their impact. There are already quite a few guides on optimizing julia written by much smarter people than myself, so if you want to checkout those resources first here they are:
This guide covers more which methods specifically helped me and which tools I found the most helpful overall in analyzing my code.
Profilers
ProfileView
What I kinda discovered is that due to the obviously varying nature where performance issues can come from the best way to improve performance is to really understand what is taking how long and how much in your code.
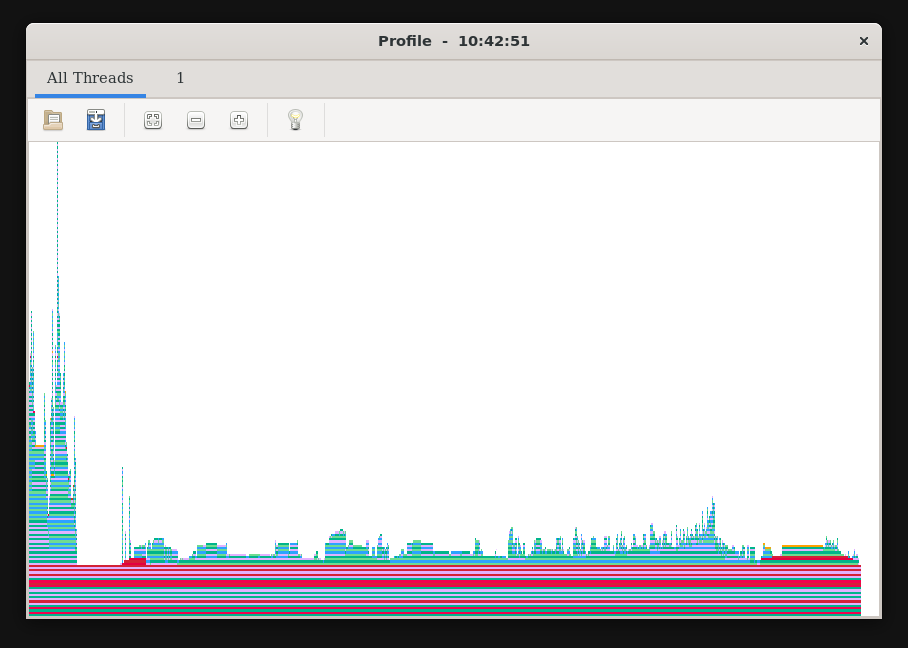
So I'd first recommend a nice basic profiler, ProfileView.jl to run the profile you need to include it then use the ProfileView.@profview macro for a function whos runtime you would like to profile.
using ProfileView
...
ProfileView.@profview myfunction();
Then you need to run this in the repl (it breaks otherwise) which depending on the platform you are on should either give you a nice window in VSCode or in my case (using WSL2) I get a GUI window that pops up.
PProf
Alternativley if you want a more advanced profiler that can analyze both runtime and allocations with differents types of views I highly recommend PProf.jl, this takes the julia profiling data and exports it to the pprof format which has some really nice visualizations. To profile CPU time do :
using Profile
using PProf

Profile.clear()
@profile myfunction()
pprof()
This will open a web browser with the pprof interface. You can also profile allocations by using @profile Allocs.@profile myfunction() instead.
Type Stability
One of the most important things to keep in mind when writing Julia code is type stability. Type stability means that the type of the output of a function can be inferred from the types of the inputs. When a function is type stable, Julia can generate efficient machine code for it.
You can check type stability using the @code_warntype macro:
@code_warntype myfunction(args...)
If you see any Any types or red highlighting in the output, that's a sign that the function is not type stable.
Avoiding Allocations
Memory allocations can be a significant source of slowdowns in Julia code. You can use the @allocated macro to check how many bytes a function allocates:
@allocated myfunction(args...)
Some tips for reducing allocations:
- Use views instead of copies when possible (
@viewor@views) - Preallocate output arrays
- Use in-place operations (functions ending with
!) - Avoid creating temporary arrays in loops
Conclusion
Optimizing Julia code can be a fun and rewarding process. The key is to measure first, then optimize. Use profilers to find the bottlenecks and focus your efforts there.